Meraki topology to a network diagram you can edit
· 2 min read
Pull Meraki devices and clients from the Dashboard API, import them into ApexDiagram, and get an editable diagram with every MX, MS and MR and their clients.
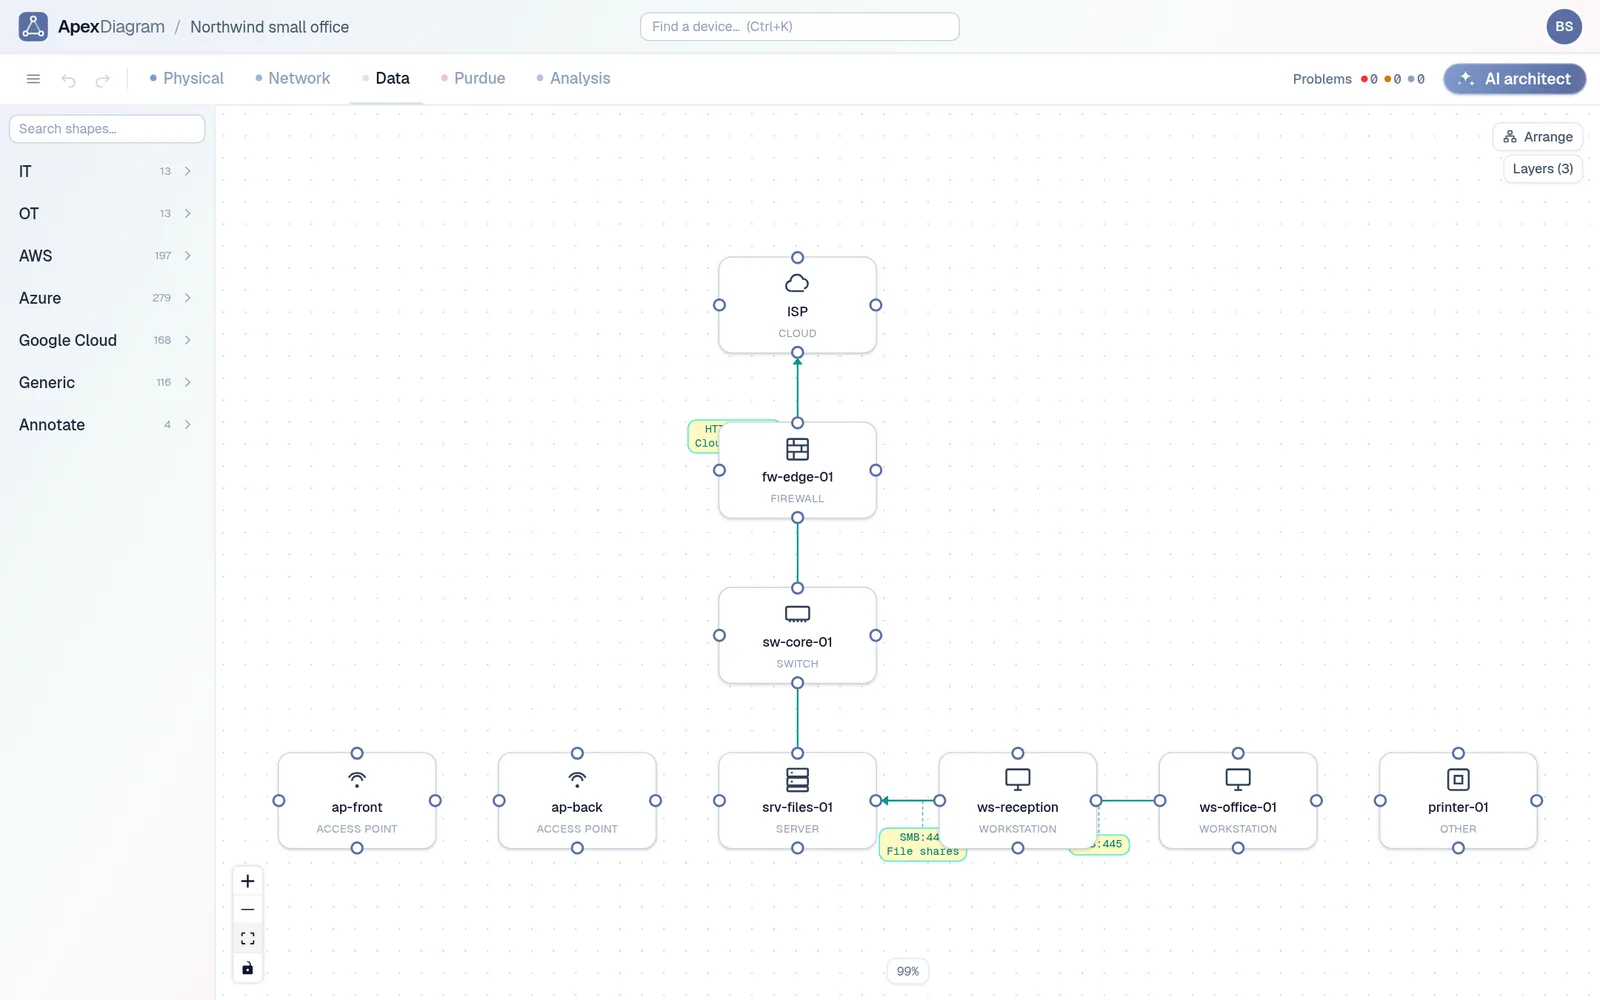
The Meraki dashboard has a topology page, and it is a good live view. It is not a document you can hand to a client, mark up with a planned change, or keep when the licence lapses. MSPs in particular want a diagram per client that they own and that matches what the dashboard says.
This guide pulls the inventory from the Meraki Dashboard API and turns it into an editable diagram.
What you need
- A Meraki API key with read access to the organisation. Create it under your profile in the dashboard.
- The organisation ID and the network ID of the site you want to document.
Fetch the devices and clients
Two calls:
KEY=your_api_key
ORG=your_org_id
NET=your_network_id

curl -s -H "Authorization: Bearer $KEY" \
  "https://api.meraki.com/api/v1/organizations/$ORG/devices" > devices.json

curl -s -H "Authorization: Bearer $KEY" \
  "https://api.meraki.com/api/v1/networks/$NET/clients?timespan=86400&perPage=1000" > clients.json

# The organisation call returns every device in the organisation: keep this site's
jq --arg n "$NET" '[.[] | select(.networkId == $n)]' devices.json > site-devices.json

jq -n --slurpfile d site-devices.json --slurpfile c clients.json \
  '{devices: $d[0], clients: $c[0]}' > meraki.json
The clients call covers the last 24 hours (timespan=86400); widen it to catch devices that are only on now and then.
Import it
Drop meraki.json on the ApexDiagram dashboard. You get:
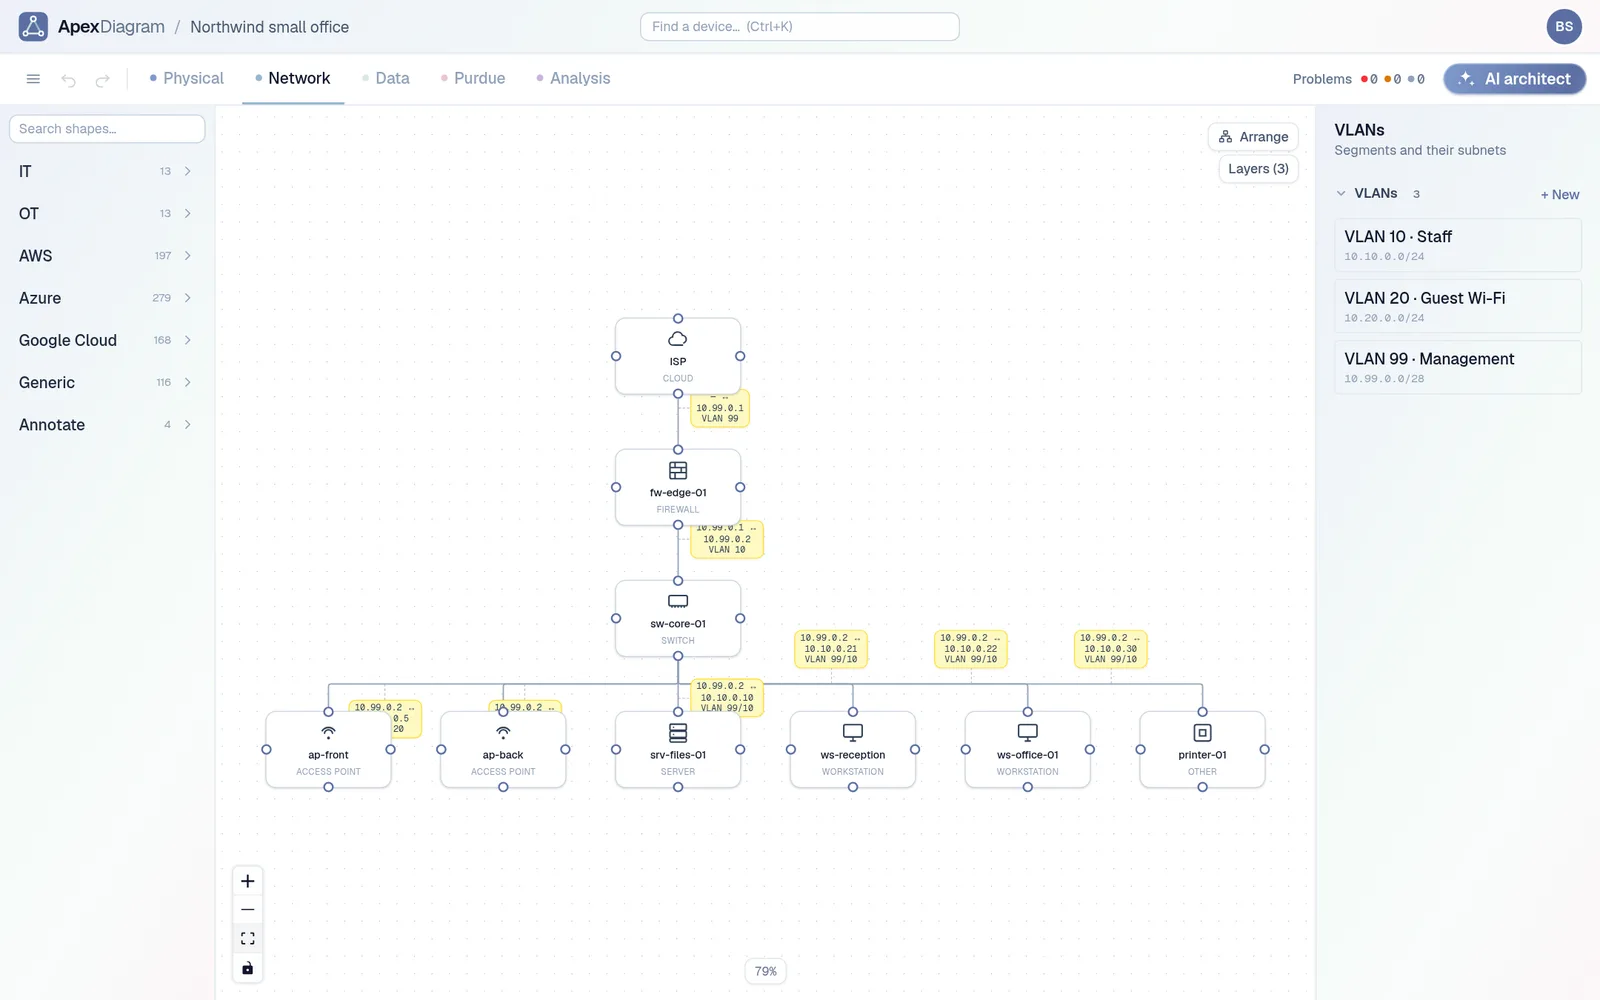
- MX and Z appliances as firewalls, MS as switches, MR as access points, MG as routers, MV as cameras, each with its serial number and model, and Cisco Meraki as the make.
- Clients, named from their description, DHCP hostname or manufacturer, with a guessed type.
- Each client linked to the device it was last seen on, on its switch port when it is wired, or as a Wi-Fi link to the AP.
Switch-to-switch and switch-to-MX uplinks are not in those two calls, so draw them, or import an LLDP neighbour export from the switches as a second step. See Turn an LLDP or CDP neighbour table into a network map.
Turn the inventory into documentation
- Place devices in the building. Racks, rooms and floors, so the diagram tells a technician where the MS is.
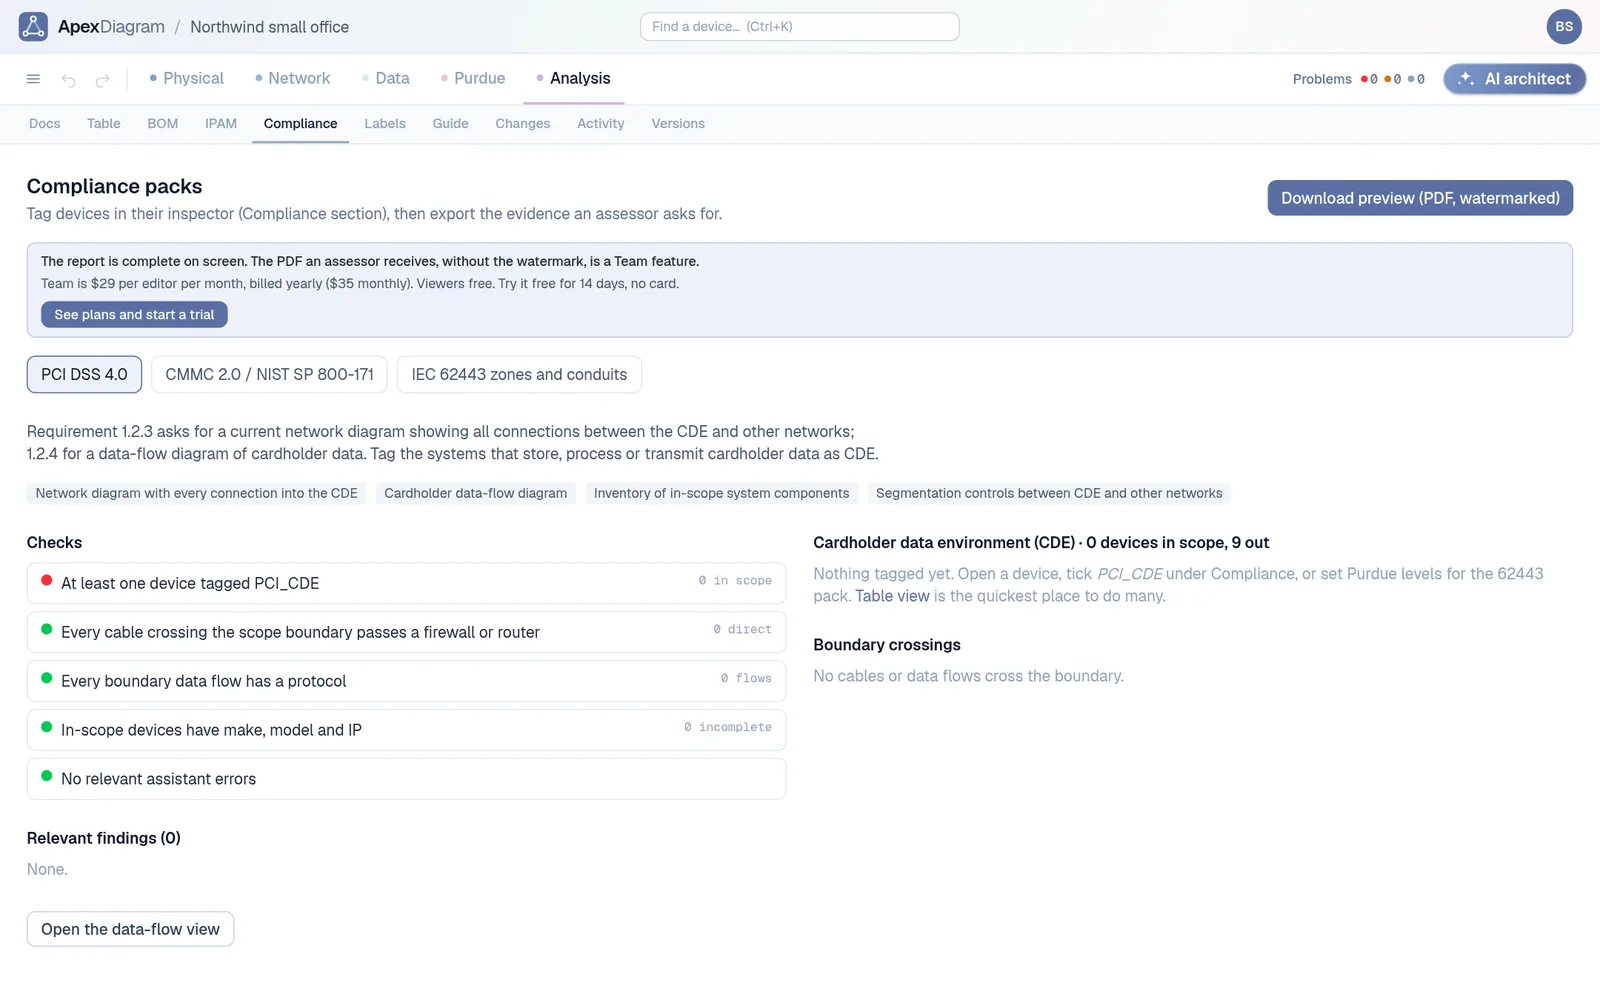
- Record the WAN circuits. Carrier, circuit ID, support phone and contract end, with a warning 90 days before it ends.
- Write down the flows. Which VLANs reach the server VLAN and why: the firewall rules exist in the dashboard, but the reason for them does not.
- Share it read-only. A share link with an expiry gives the client or a contractor a view of the diagram without a dashboard login.
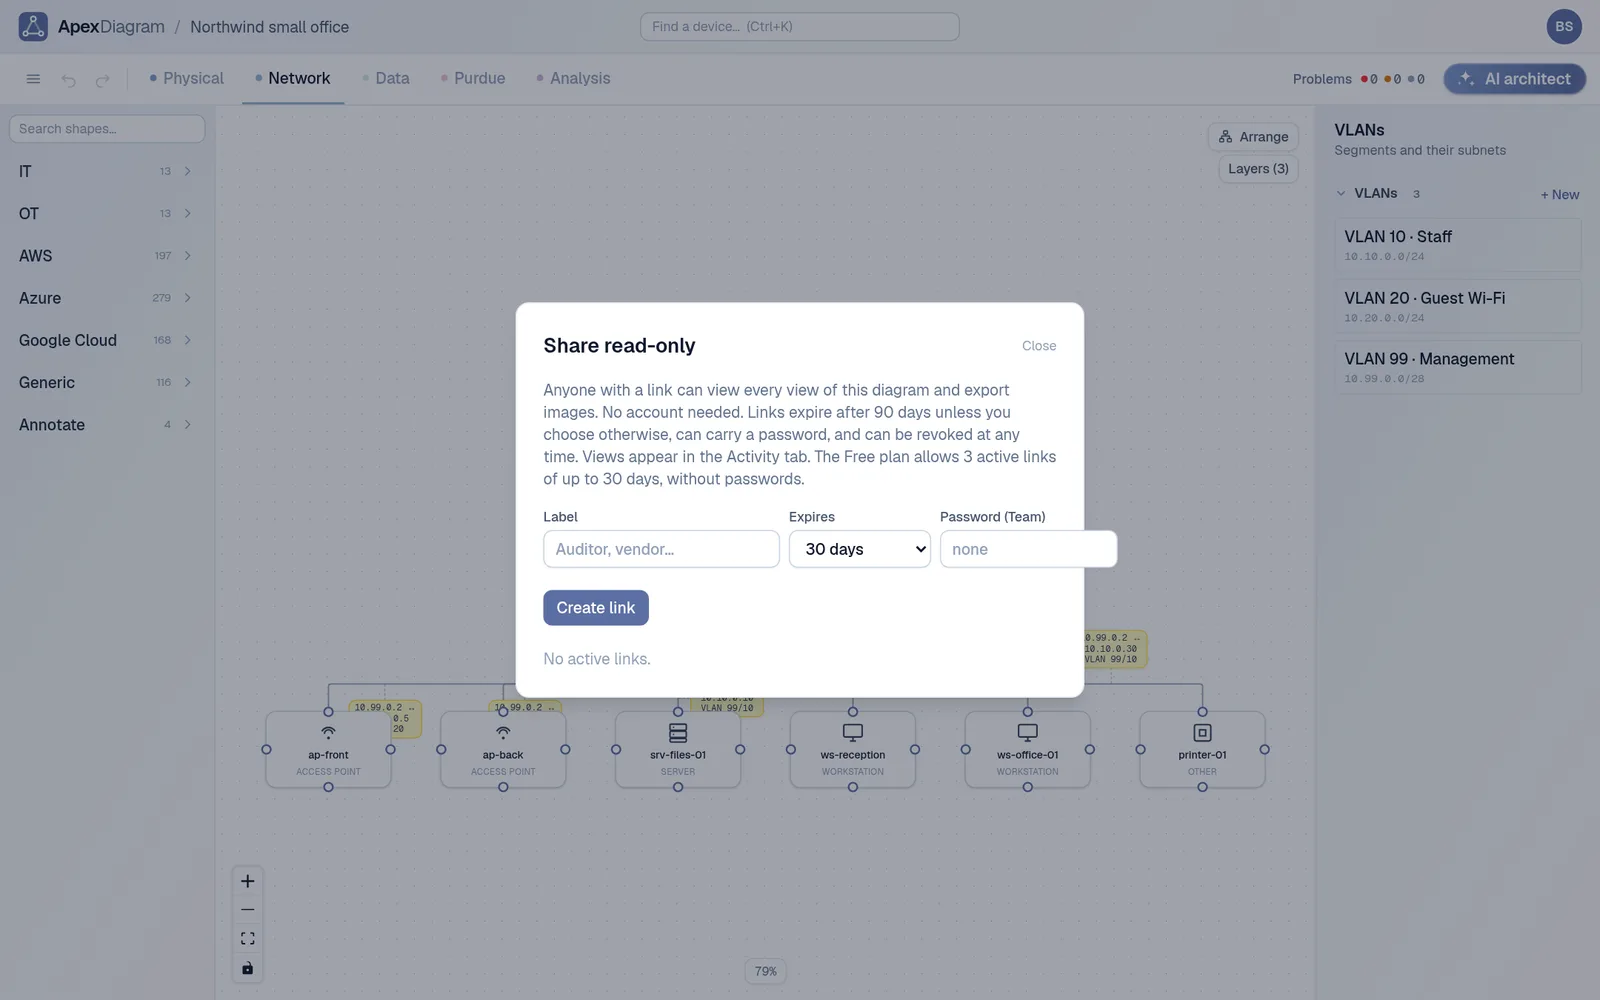 A read-only share link for the client
Keep it in step
Rerun the calls when the site changes and use Refresh from file. ApexDiagram shows the diff (new APs, departed clients, changed addresses) before applying it, keeps your locations and notes, and saves a version first.
For MSPs, each client can be its own organisation in ApexDiagram, which keeps client data apart. Our MSP handover pack checklist covers what else belongs alongside the diagram. See plans and pricing.
Document your network once, keep it current
One network graph, four synchronized views, a linter and a bill of materials. Import the Visio or draw.io file you already have.
Join the beta