Your network diagram is already wrong
· 4 min read
Six things that go wrong with network diagrams drawn in Visio, Lucidchart or draw.io, and what a diagram that is a record instead of a picture does about each.
Somebody asks for the network diagram. You find it. It is a Visio file from two years ago, or a draw.io export in the wiki, or a photo of a whiteboard. It shows the old firewall, a switch that was replaced in March, and a VLAN that no longer exists. You spend an afternoon fixing it, send it, and it starts going stale again the moment you close the file.
That afternoon is the problem ApexDiagram was built to remove. Here is what goes wrong with the usual tools, and what we do differently.
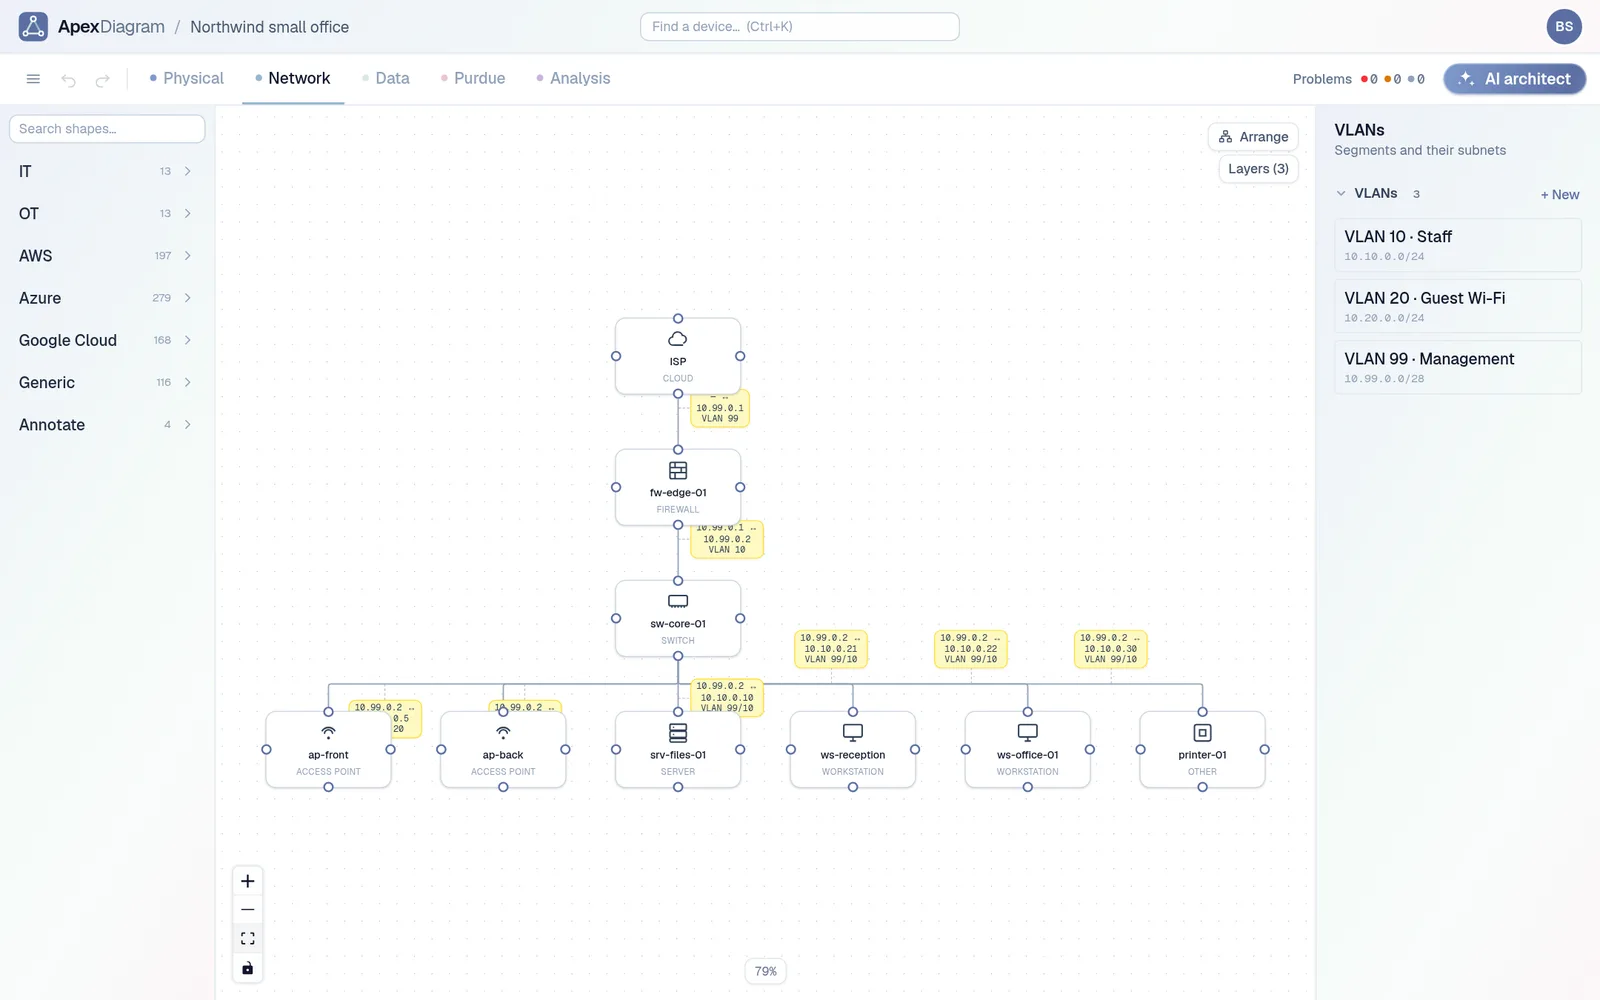 The Network view of a small office in ApexDiagram
Problem 1: the diagram is a picture, so it cannot be wrong
In Visio, Lucidchart or draw.io, a switch is a rectangle with a label. A cable is a line. The tool has no idea that the line is a Cat6 run from port 3 of one switch to port 12 of another. So it cannot tell you that two devices share an IP, that a cable is 140 metres long, or that a server sits in a rack unit that is already occupied. It draws whatever you draw.
ApexDiagram stores a device as a record: name, make, model, ports, addresses, VLAN, rack slot, Purdue level. Seventeen linter rules run over that record and list the problems: duplicate IPs, addresses outside their subnet, cables longer than their type allows, zone crossings, rack overlaps, orphan devices. Click a finding and the canvas opens on the offending device.
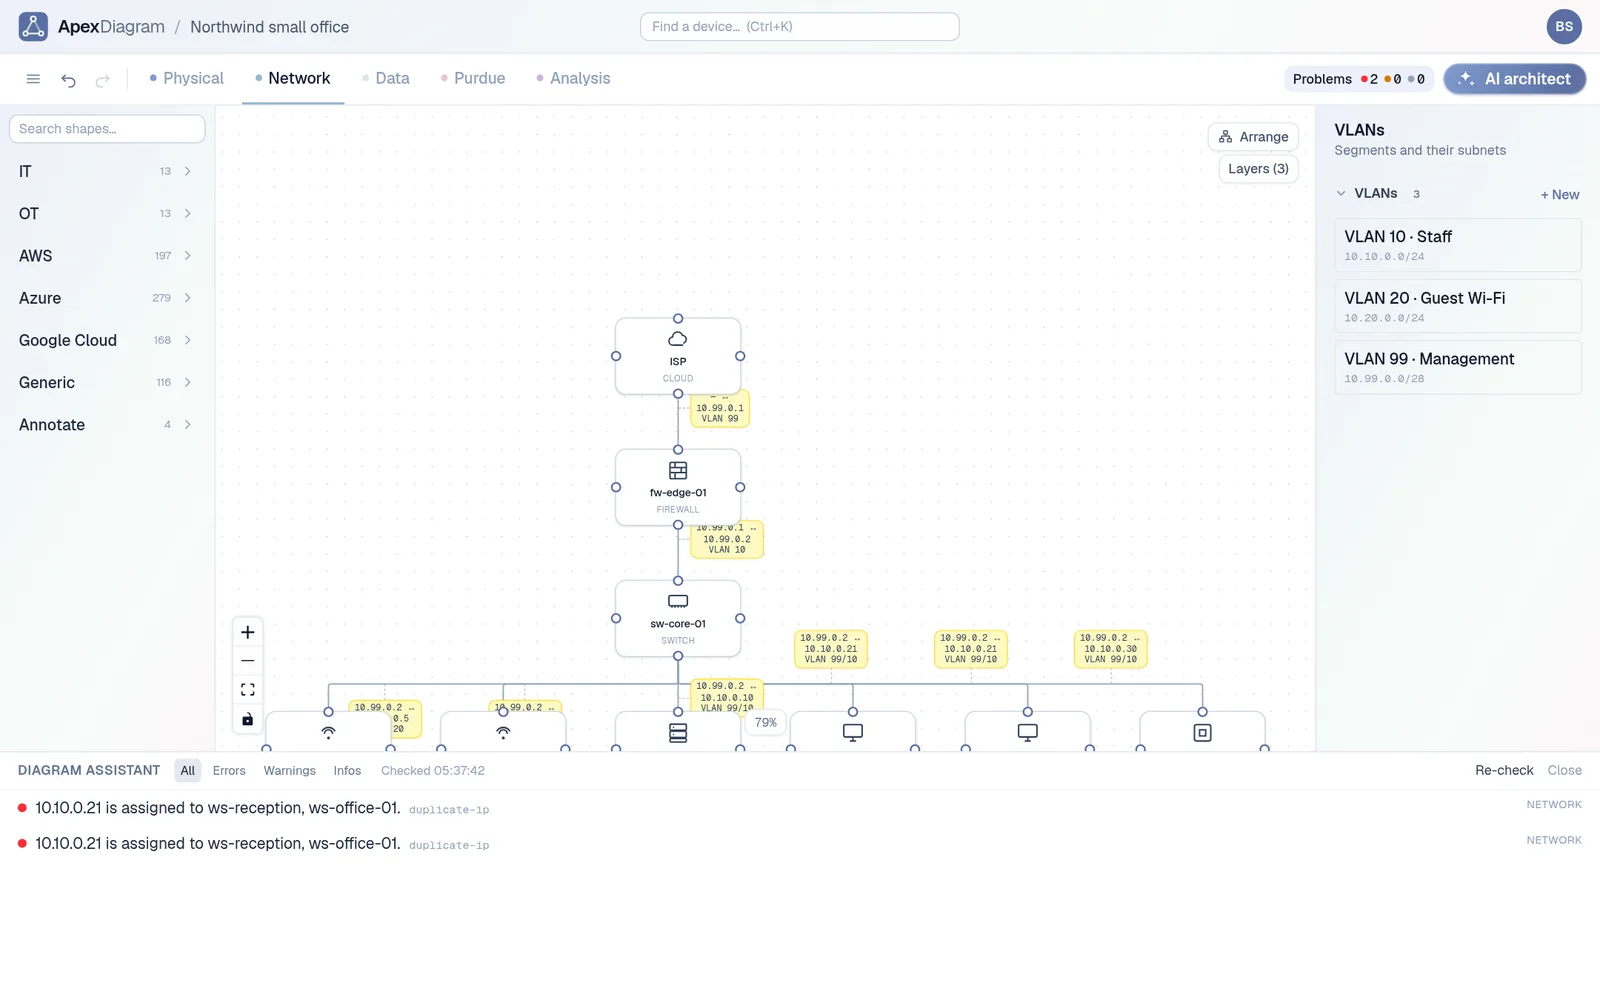 The diagram assistant reporting a duplicate IP
Problem 2: one network, four diagrams, four versions of the truth
The auditor wants a data-flow diagram. The cabling contractor wants the physical layout. The new hire wants the logical topology with VLANs. The OT engineer wants Purdue levels. So you draw four diagrams, or four pages, and every change to the network has to be made four times. It never is.
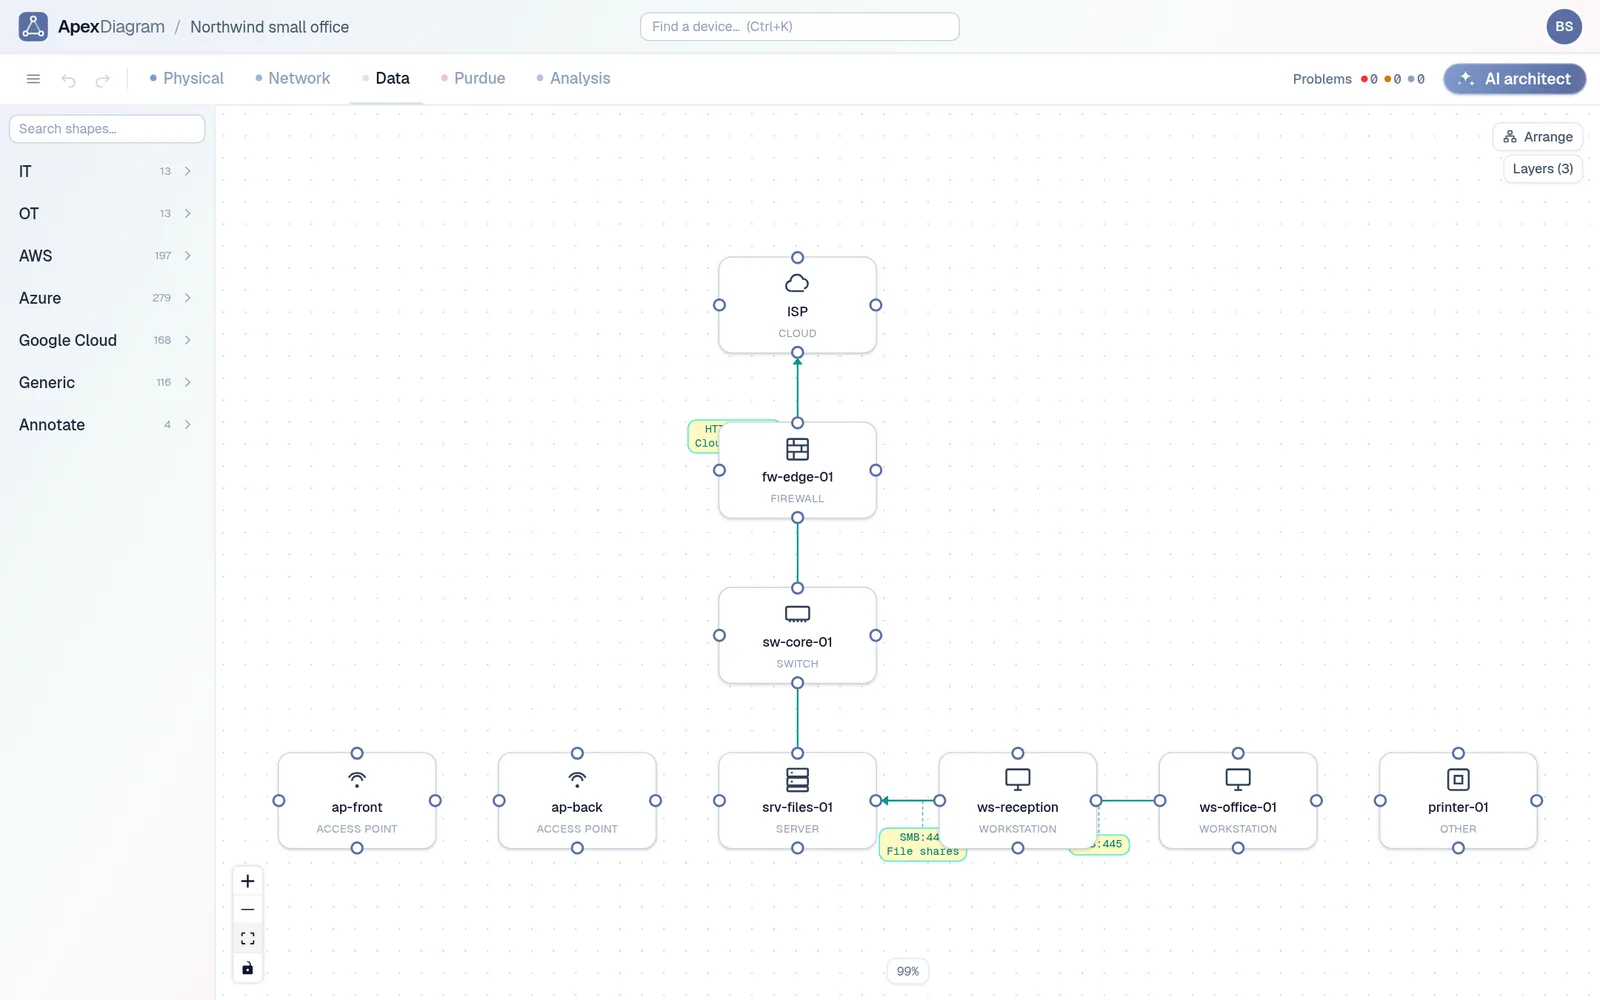
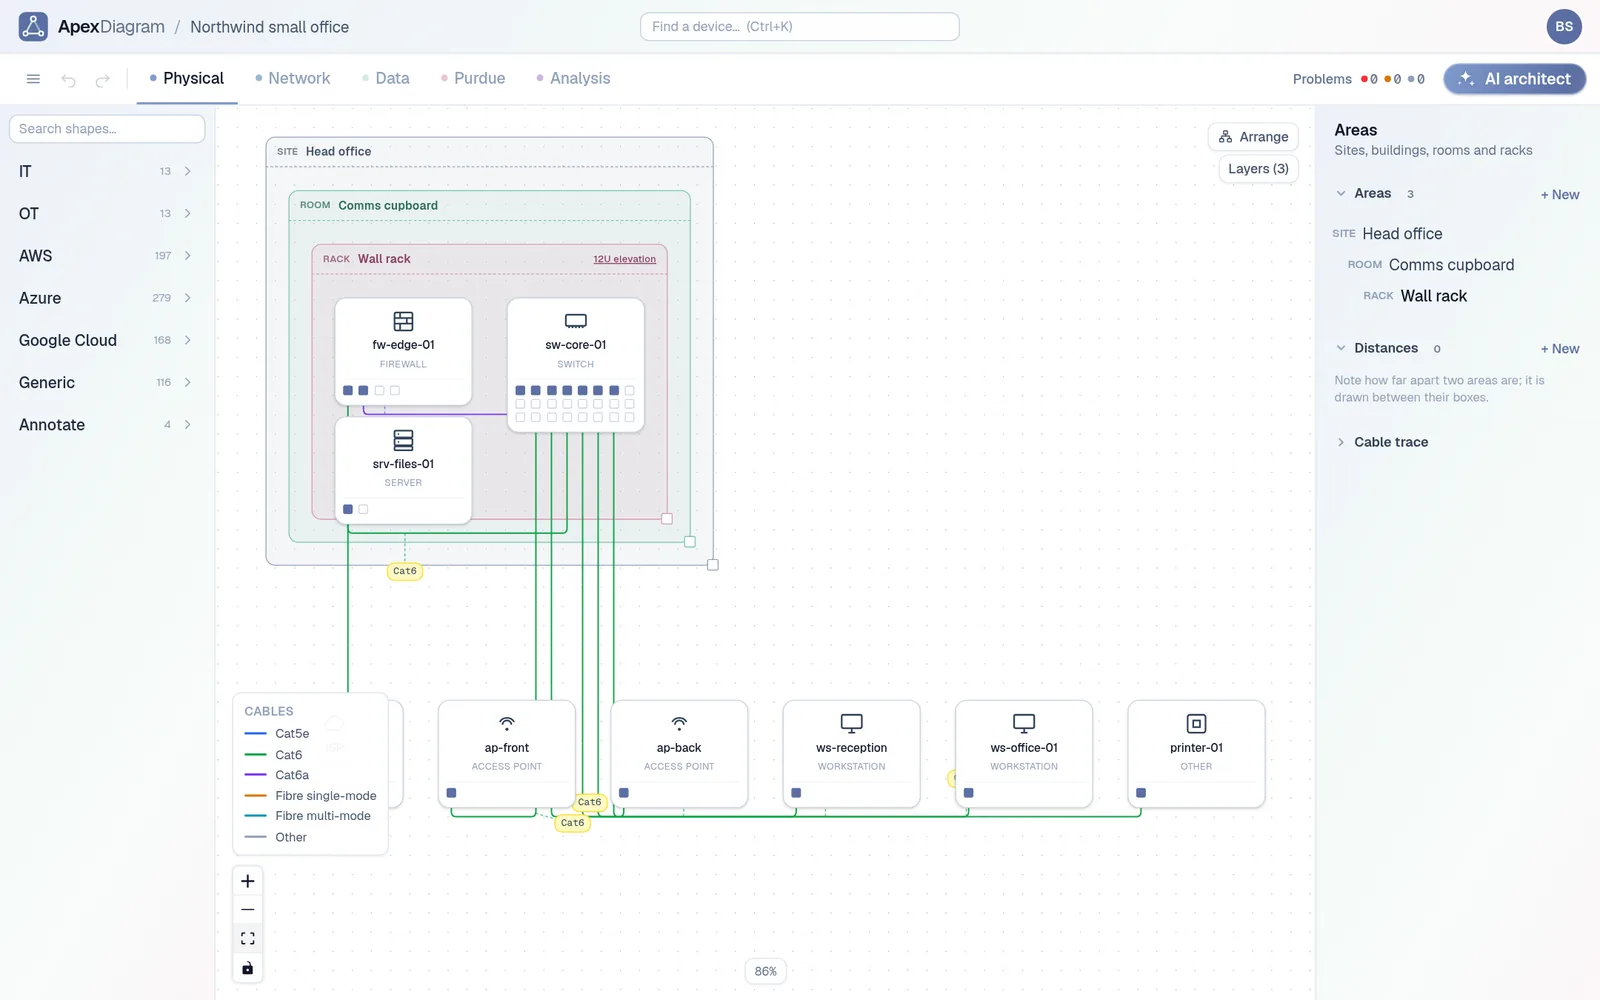
In ApexDiagram a device exists once and is shown in four views that follow the OSI model: Physical for layer 1, Network for layers 2 and 3, Data for layers 4 to 7, and Purdue for OT zones. Rename it, change its IP, or move it to another VLAN in any view, and the other three update. There is nothing to copy, so nothing drifts.
The same devices in the Physical view: site, room, rack and cable types
Problem 3: the diagram goes stale the day after you draw it
Discovery tools solve staleness with a collector on your network and a per-device bill. Most small companies do not want either. So the diagram stays manual and stays old.
ApexDiagram takes the middle path. Drop a newer file, a pfSense config, an nmap scan, an LLDP neighbour table, a UniFi or Meraki export, or a NetBox pull, and it shows a diff: devices added, removed and changed, links added and removed. You approve the changes. A version is saved first, every time. No agent, no poller, nothing installed on the network.
Problem 4: the diagram does not help you buy, label or build anything
A drawing of twelve devices does not tell procurement what to order. ApexDiagram rolls the record up into a bill of materials with cost, exports it as CSV, Excel or PDF, and prints device and cable labels with QR codes that open the device record on a phone. The same record exports a Containerlab topology so you can boot the network you drew and test a change before you make it.
 A bill of materials rolled up from the diagram
Problem 5: compliance asks for things a drawing cannot prove
PCI DSS 4.0 requires a current network diagram and a cardholder data-flow diagram. CMMC and NIST 800-171 want network and information-flow diagrams in the System Security Plan. IEC 62443 wants documented zones and conduits. Each one asks "is this current" and "what crosses the boundary".
Tag the devices in scope and the Compliance tab lists the in-scope inventory, every cable and flow that crosses the boundary, and the findings that matter for that framework. One button produces the audit pack as a PDF: the two views the framework wants, inventory, boundary crossings, findings and the BOM.
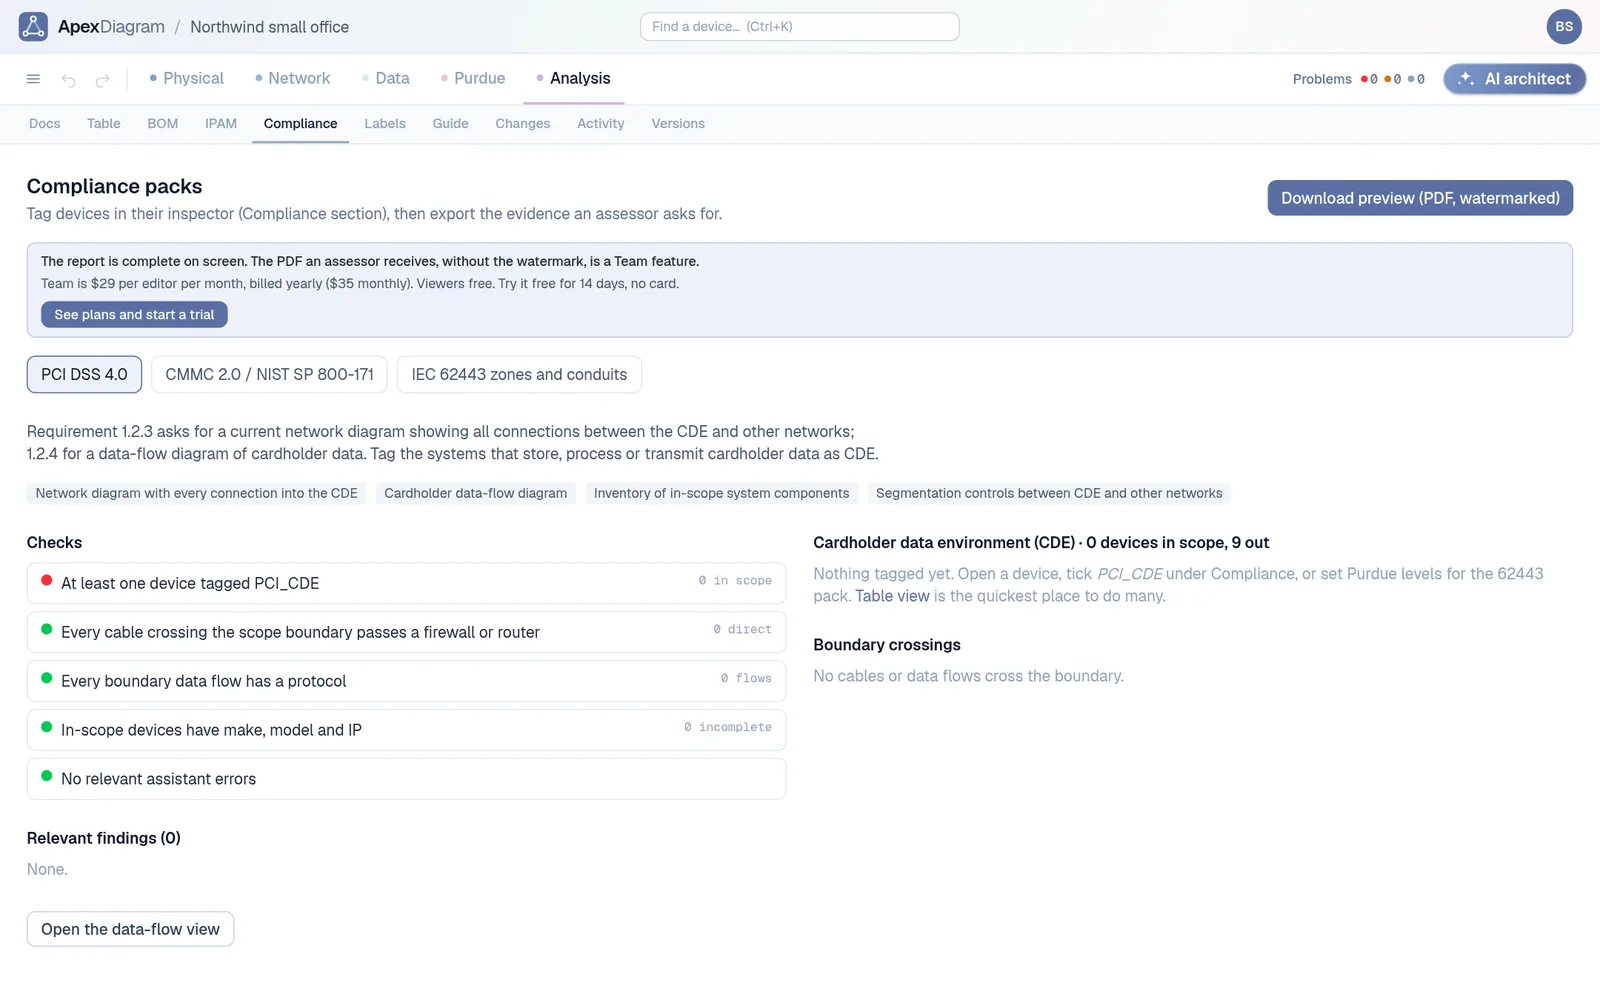 The Compliance tab
Problem 6: starting from a blank canvas
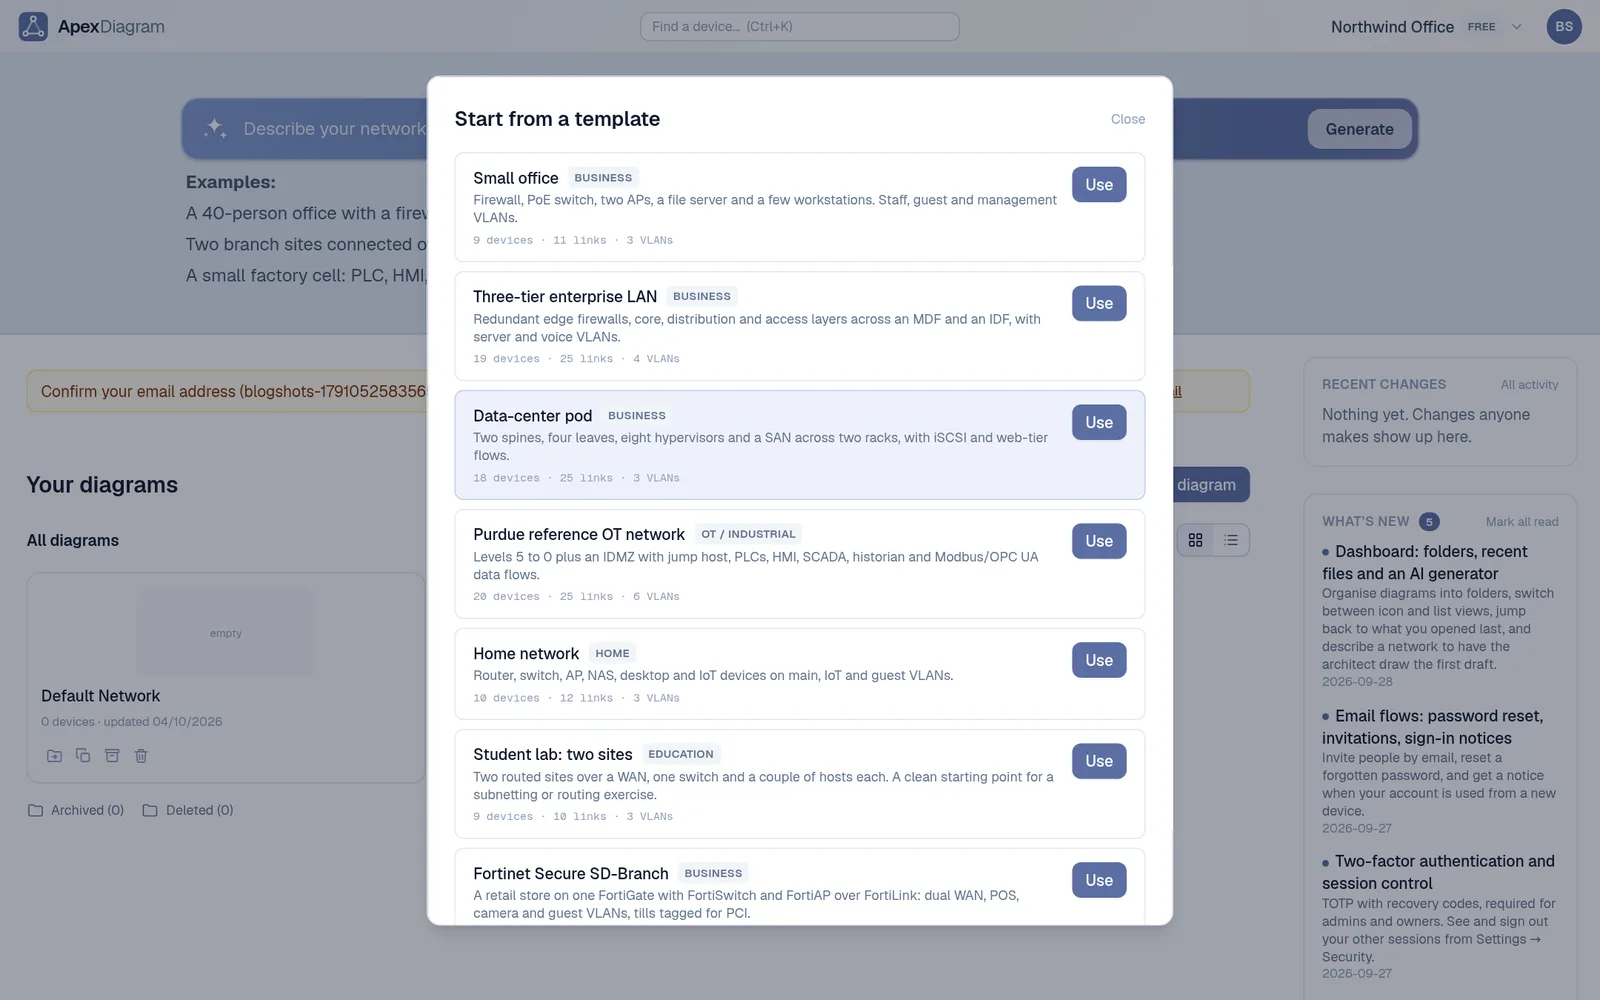
The first hour in any diagramming tool is spent hunting for stencils. ApexDiagram ships templates for a small office, a two-site routing lab, a home network and a Purdue reference OT network, plus auto-layout for every view. Or describe the network in a sentence and let the architect add the devices, VLANs and cables, explaining each step and saving a version before it touches anything.
See what yours is hiding
Drop in your current Visio or draw.io file and see what the linter finds in the next five minutes. Teams get collaboration, change approval and an audit trail; MSPs get an organisation per client. See plans and pricing.
Import the diagram you already have at apexdiagram.com. It will probably find something wrong with it. That is the point.
Document your network once, keep it current
One network graph, four synchronized views, a linter and a bill of materials. Import the Visio or draw.io file you already have.
Join the beta