Physical vs logical network diagram: what each one shows, with examples
· 3 min read
A physical diagram shows where things are and how they are cabled. A logical one shows how traffic moves. What goes on each, and why you need both.
Every network documentation guide says you need a physical diagram and a logical diagram. Few say where one stops and the other starts. The short answer: a physical diagram answers where is it and what is it plugged into, and a logical diagram answers how does traffic get from here to there.
The physical diagram
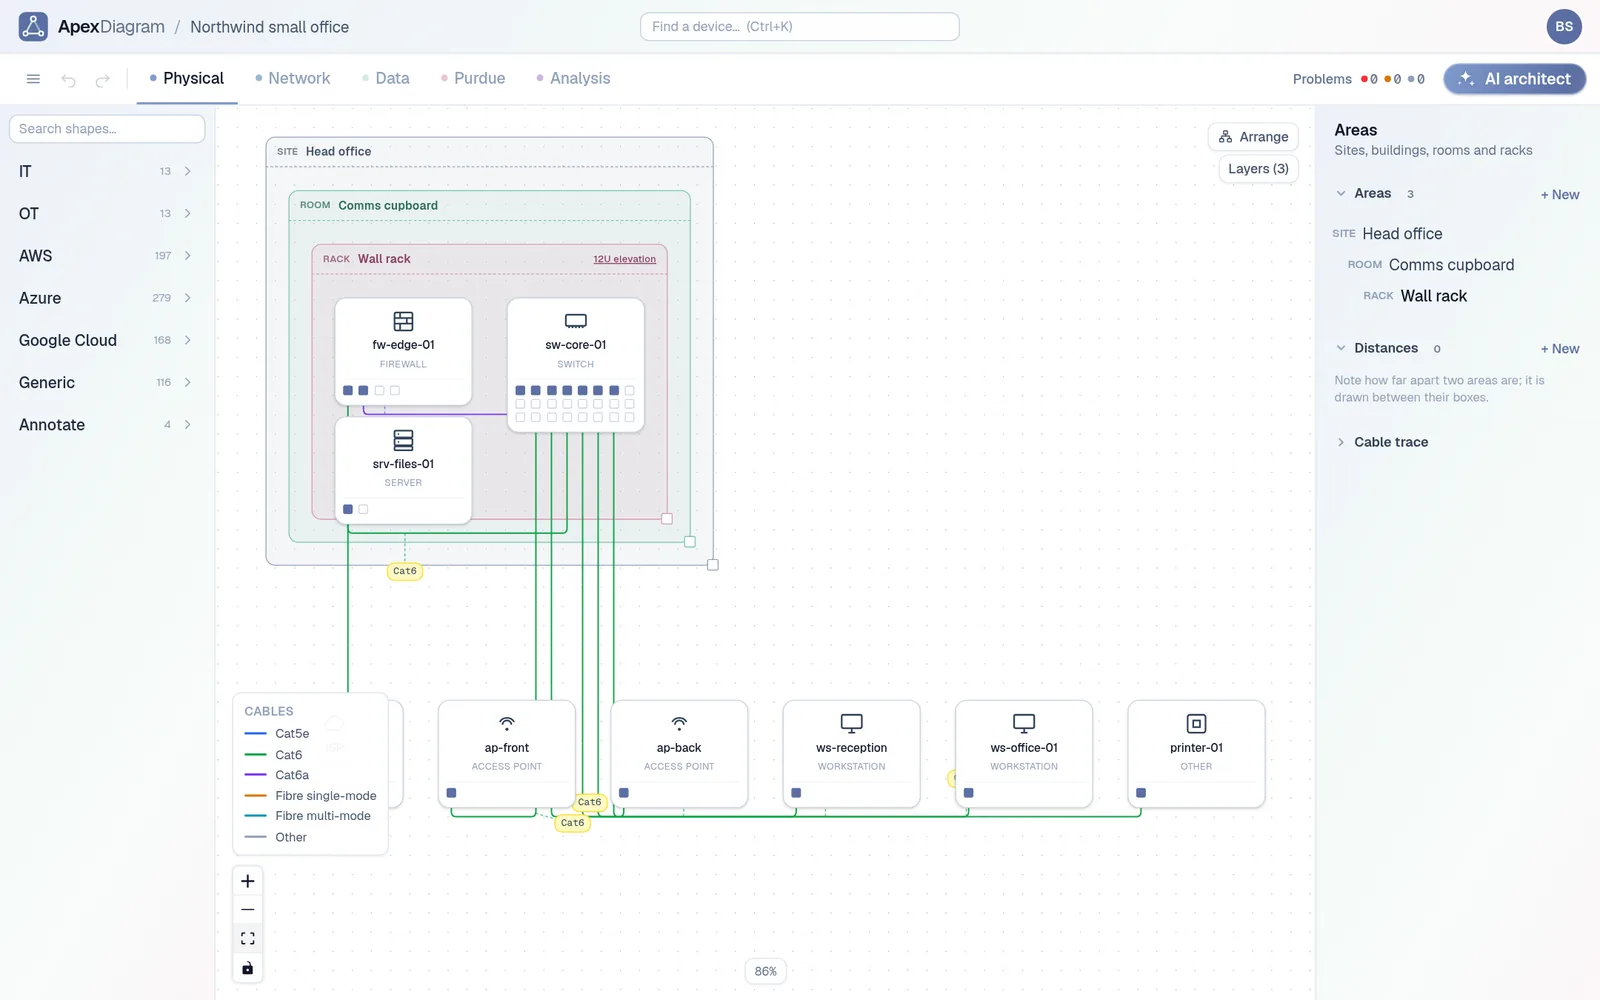
A physical diagram is the network as a cabling contractor sees it. It shows:
- Places. Sites, buildings, floors, rooms and racks, nested the way they are in real life.
- Devices in those places. Which rack, which rack unit, which wall.
- Cables. Which port on which device goes to which port on which other device, the cable type (Cat6, Cat6a, single-mode fibre) and its length.
- Patch panels. The step in the middle that everyone forgets, and the reason a cable trace takes an afternoon.
It does not need IP addresses. A technician replacing a failed switch needs to know that port 14 goes to patch panel B, port 7, not that the far end lives in 10.10.0.0/24.
The Physical view: areas nested by site, room and rack, cables coloured by type
The logical diagram
A logical diagram is the network as a packet sees it. It shows:
- Subnets and VLANs. Which devices share a broadcast domain, and which are separated.
- Addresses. The IP on each interface, the gateway of each subnet.
- Routing and filtering points. Routers, firewalls and layer 3 switches, the places where traffic changes subnet or gets inspected.
- Trunks. Which links carry which VLANs.
It usually ignores rooms and racks. Two servers in different buildings on the same VLAN sit next to each other on a logical diagram.
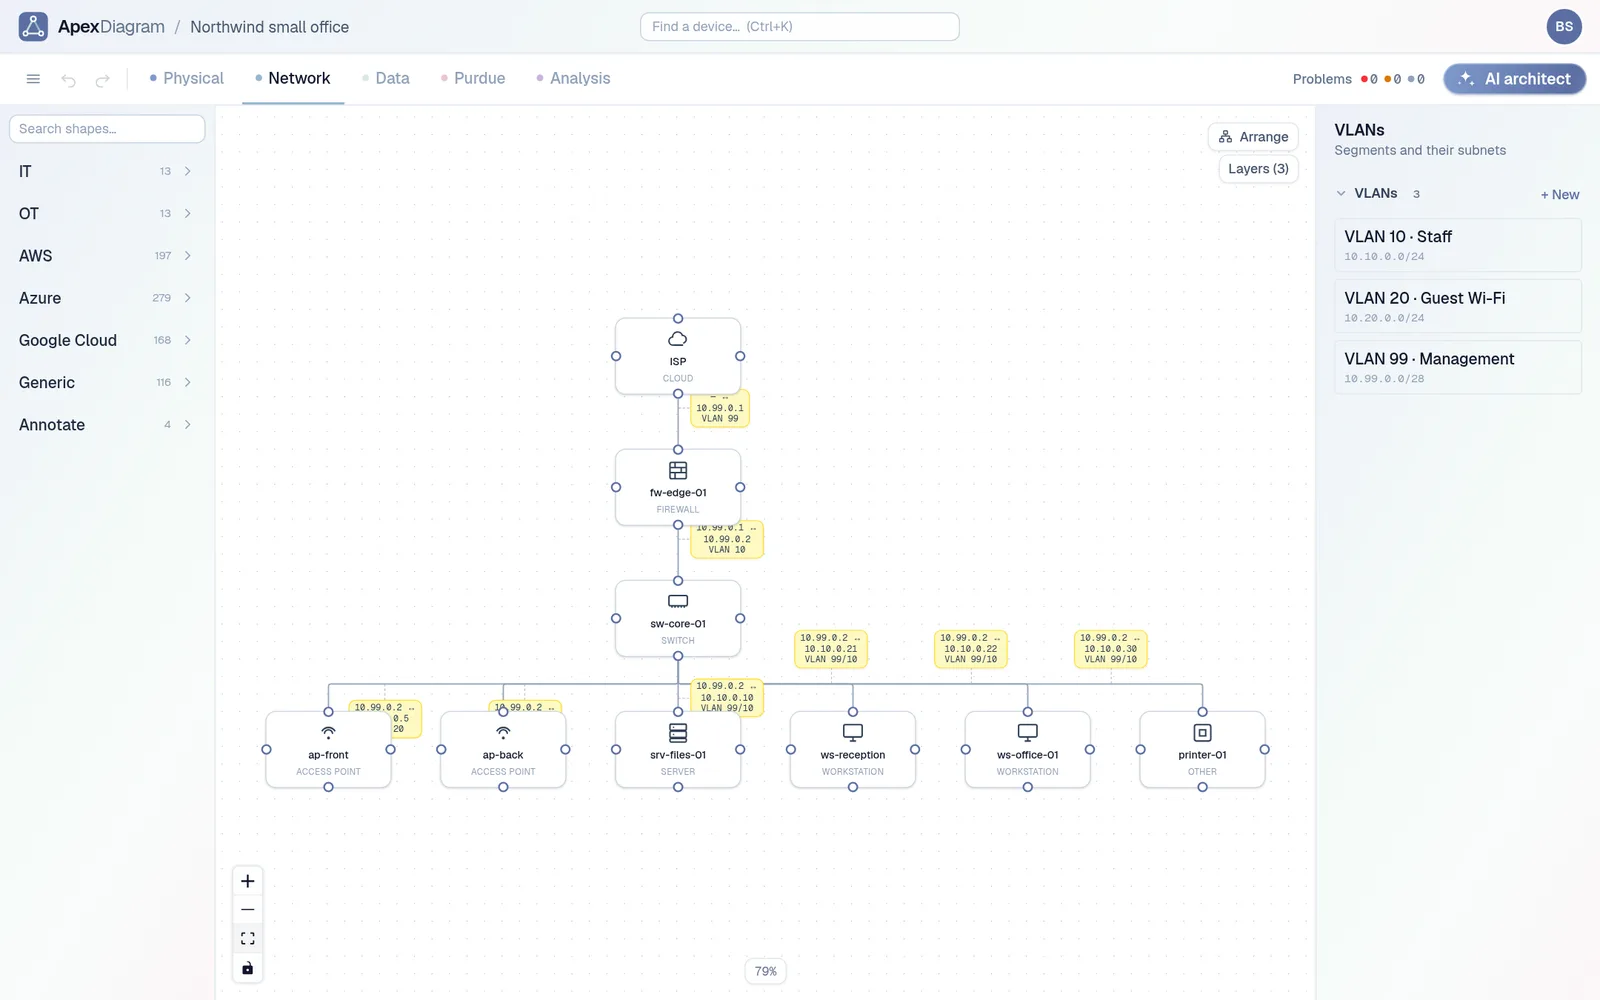 The Network view: addresses and VLANs on every link
Where the OSI model fits
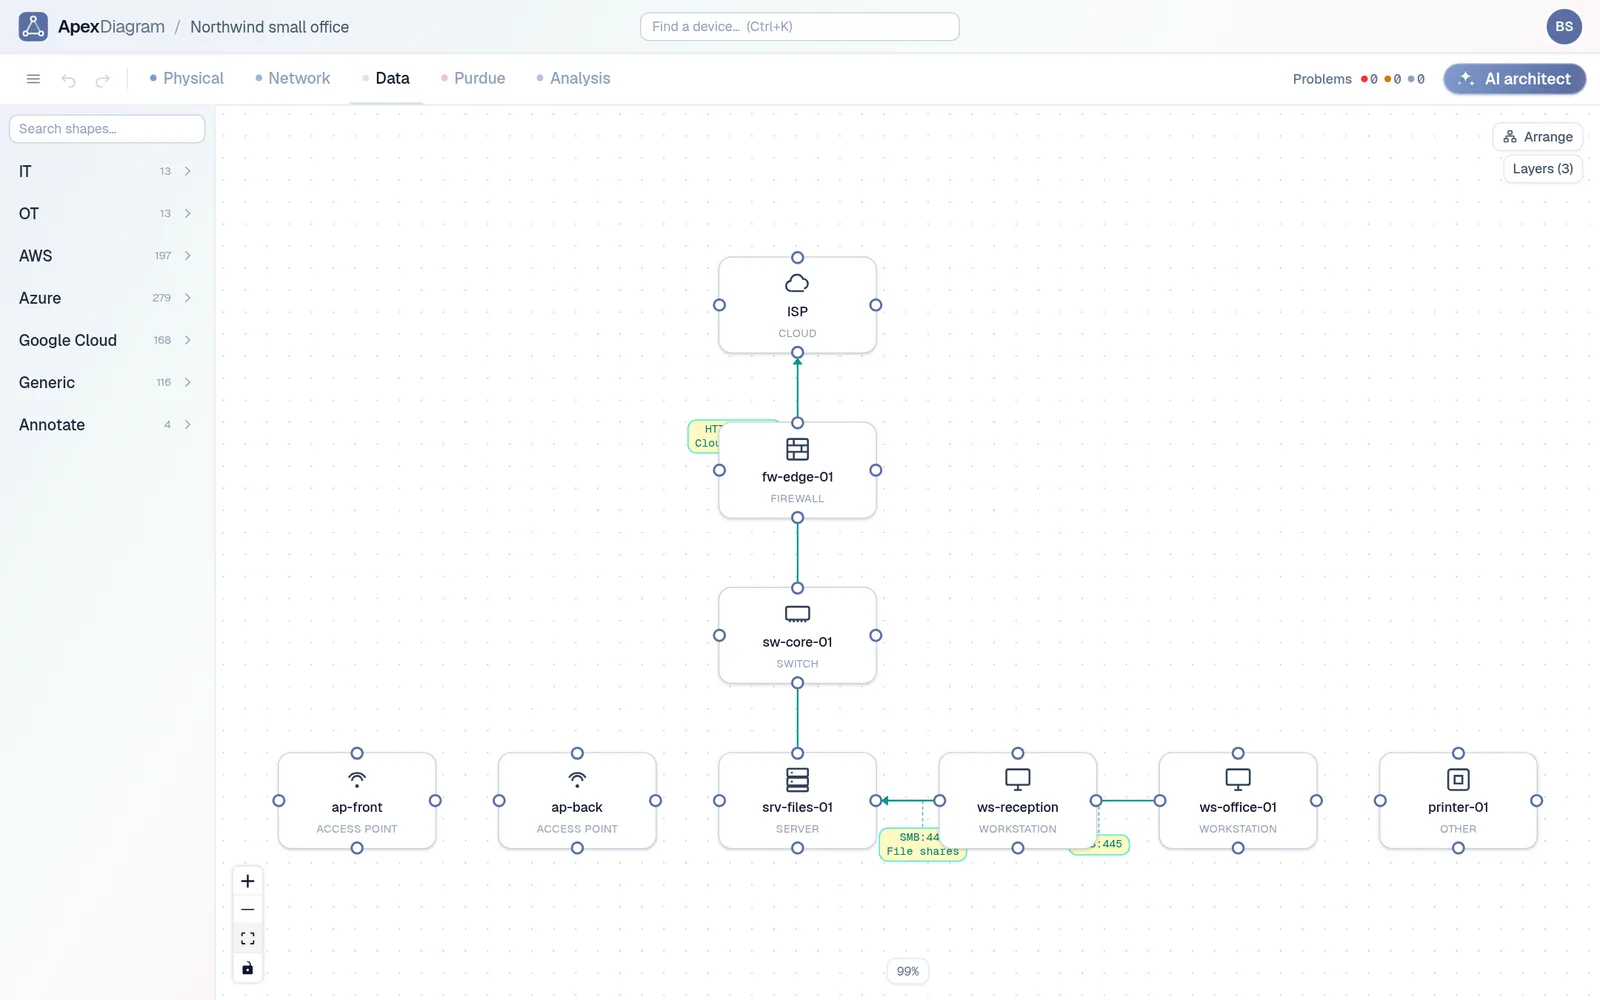
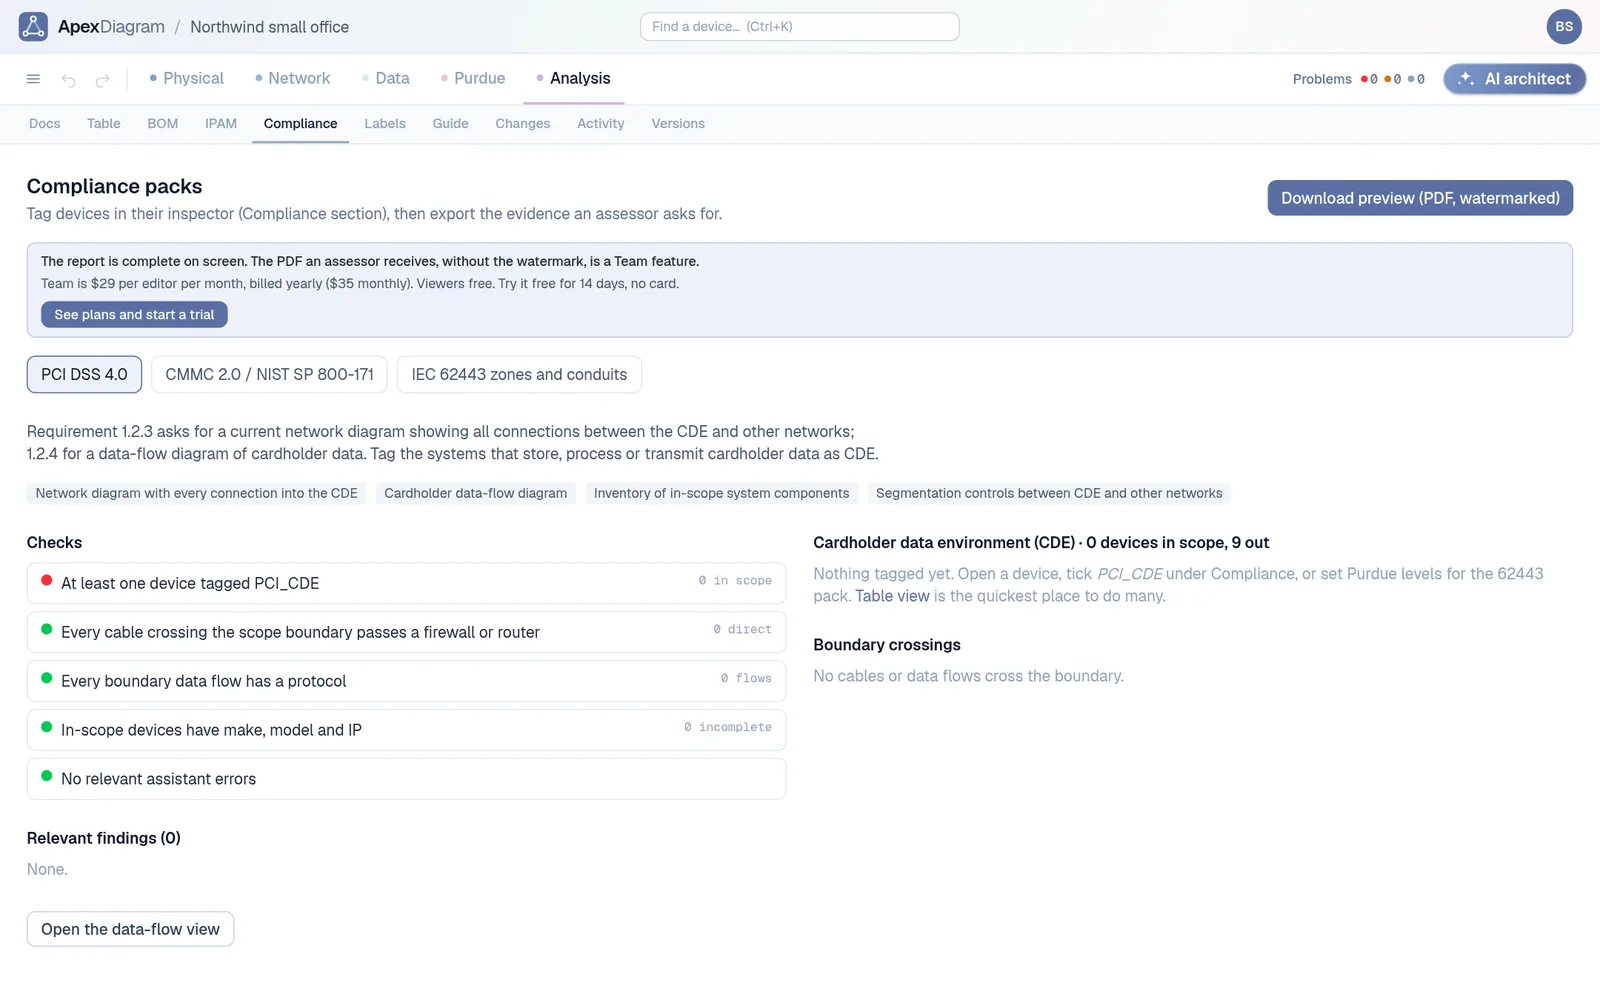
The split lines up with the bottom of the OSI model. Layer 1 is the physical diagram: cables, connectors, ports. Layers 2 and 3 are the logical diagram: VLANs, MAC addresses, subnets and routes. Layers 4 to 7 are a third picture people often skip: the data-flow diagram, which shows which application talks to which, on what protocol and port. Compliance frameworks ask for that one by name. PCI DSS 4.0, for example, wants a cardholder data-flow diagram as well as a network diagram.
A side-by-side example
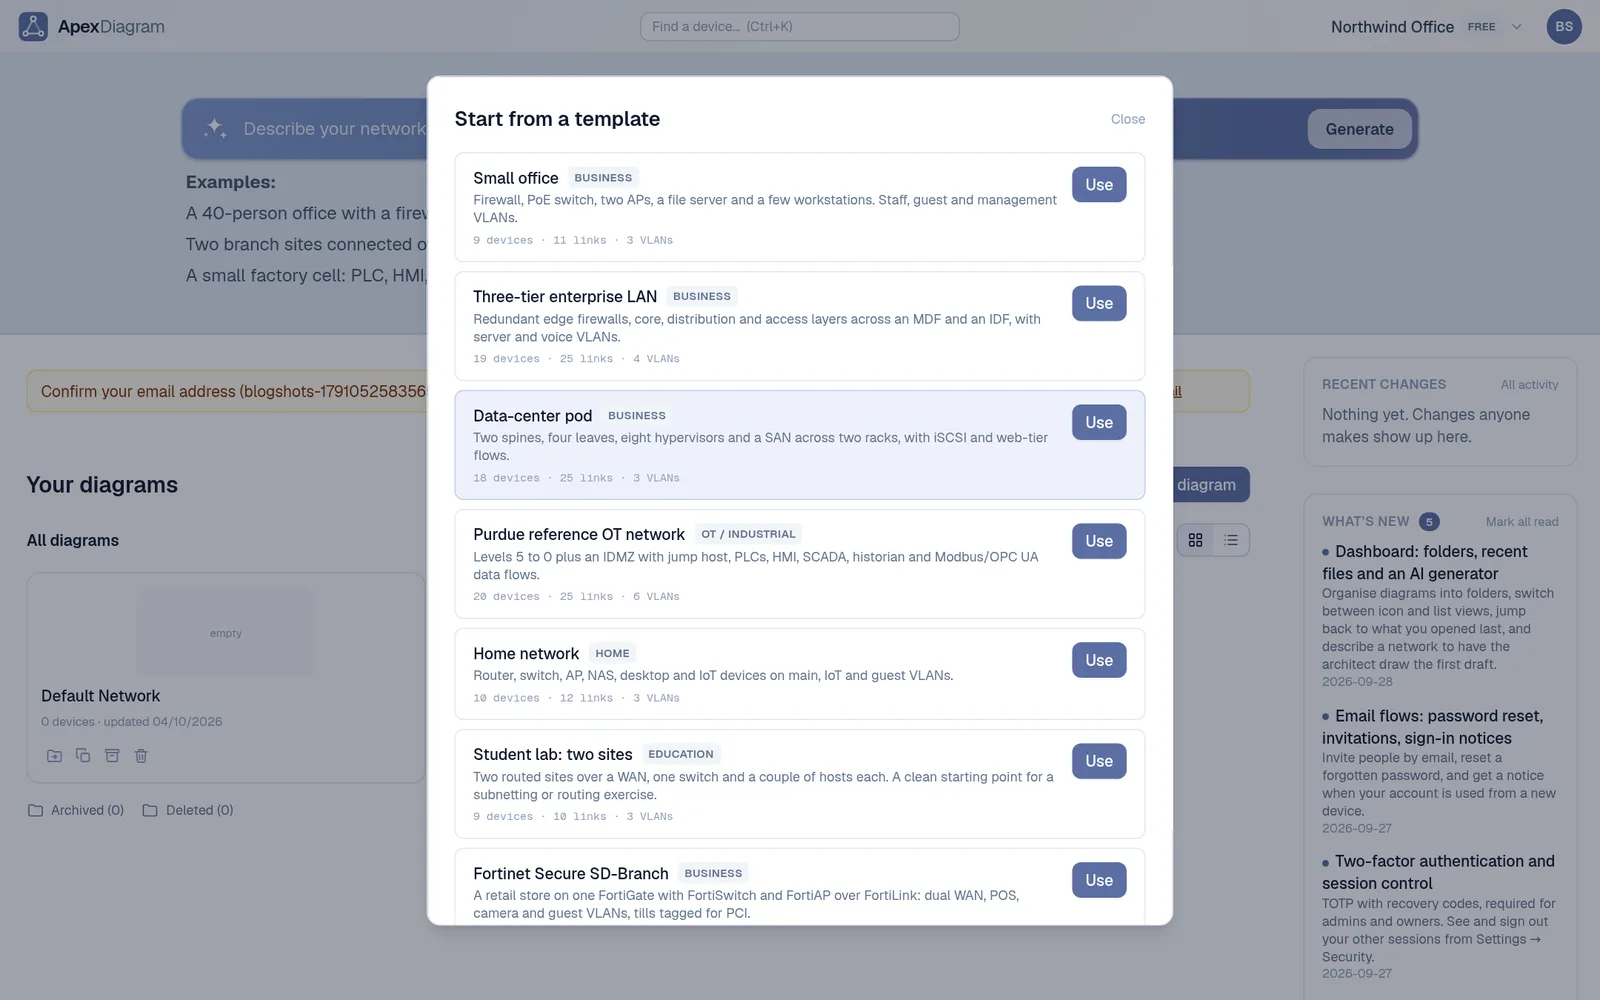
Take a small office: a firewall, a core switch, a file server, two access points, two workstations and a printer, on Staff, Guest Wi-Fi and Management VLANs.
| Question | Physical diagram | Logical diagram | Data-flow diagram |
|---|---|---|---|
| Where is the file server? | Comms cupboard, wall rack, U4 | 10.10.0.10 on VLAN 10 Staff | Serves SMB to the workstations |
| How is the AP connected? | Port 7 on the core switch, Cat6, 22 m | Trunk carrying VLANs 10 and 20 | Guest traffic goes straight to the internet |
| What happens if the switch dies? | Which cables to move to the spare | Which subnets lose their path | Which applications stop |
Why keeping them separate goes wrong
In a drawing tool, the physical and the logical diagram are two files or two pages. They describe the same switches, but nothing links them. Replace the core switch and you edit both by hand, then the rack drawing, then the IP spreadsheet. One of them is always behind.
The fix is to keep one record of the network and draw the views from it. That is how ApexDiagram works: a device has its rack unit, its ports, its cables, its addresses and its flows, and the Physical, Network and Data views are three ways of looking at the same device. Open a device and its OSI stack shows all of it in one place.
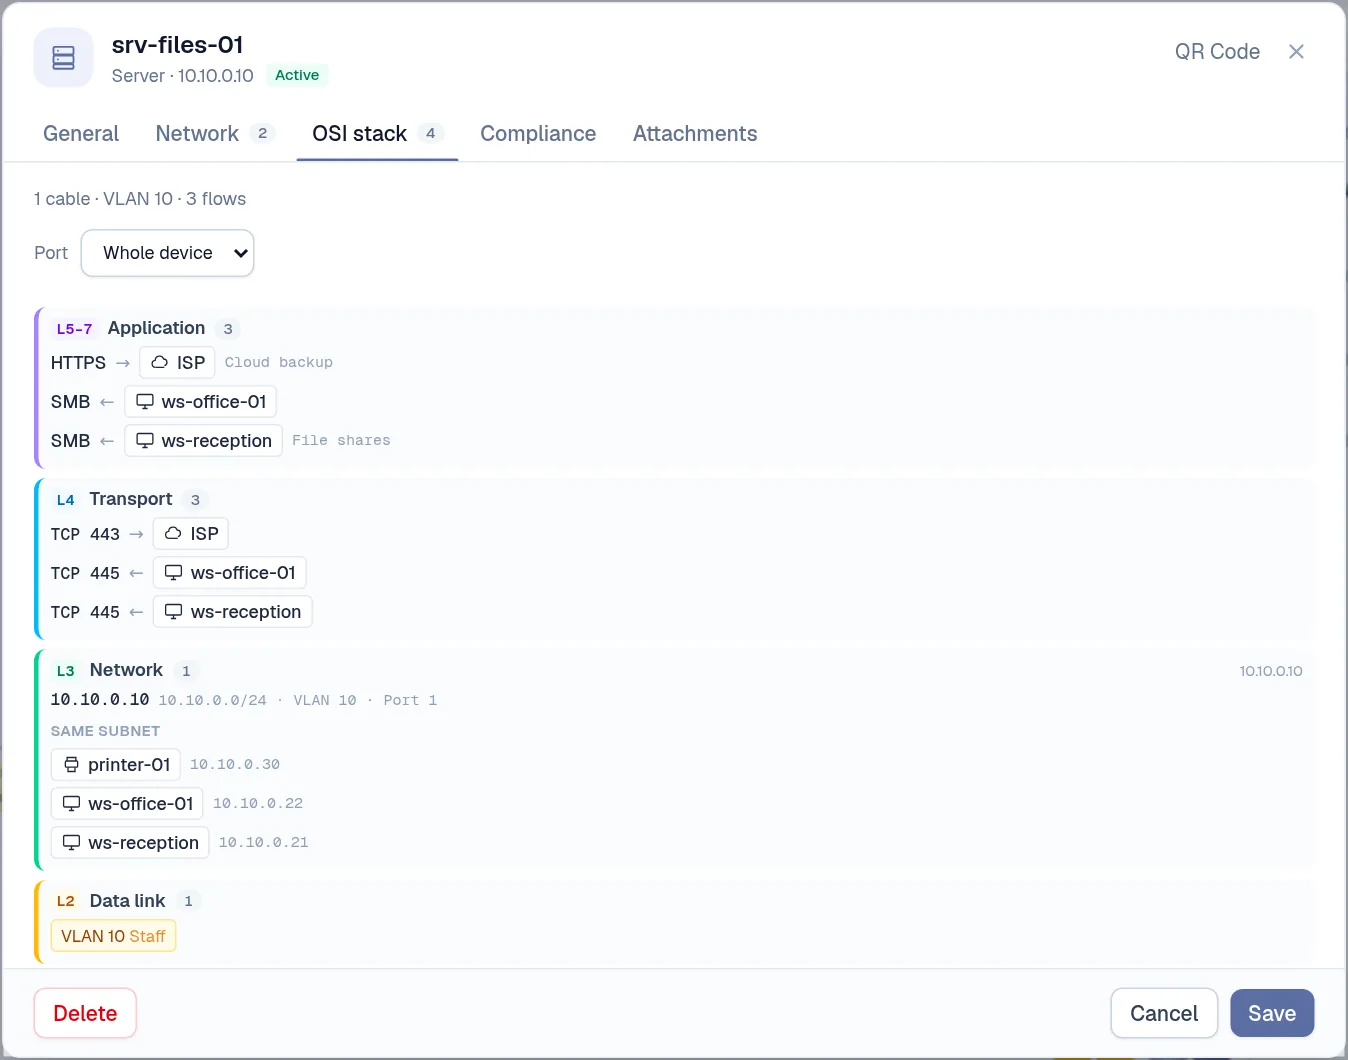 One device's OSI stack: the flows, the transport ports, the subnet and the VLAN
What to do next
If you already have both diagrams, check that they agree: same device names, same count, same uplinks. If they do not, that is the first finding. If you have neither, start with the physical one: walk the racks, record the cables, then add addresses on top.
Or import the diagram you already have and let ApexDiagram draw the other views from it. See plans and pricing.
Document your network once, keep it current
One network graph, four synchronized views, a linter and a bill of materials. Import the Visio or draw.io file you already have.
Join the beta